What is server monitoring?
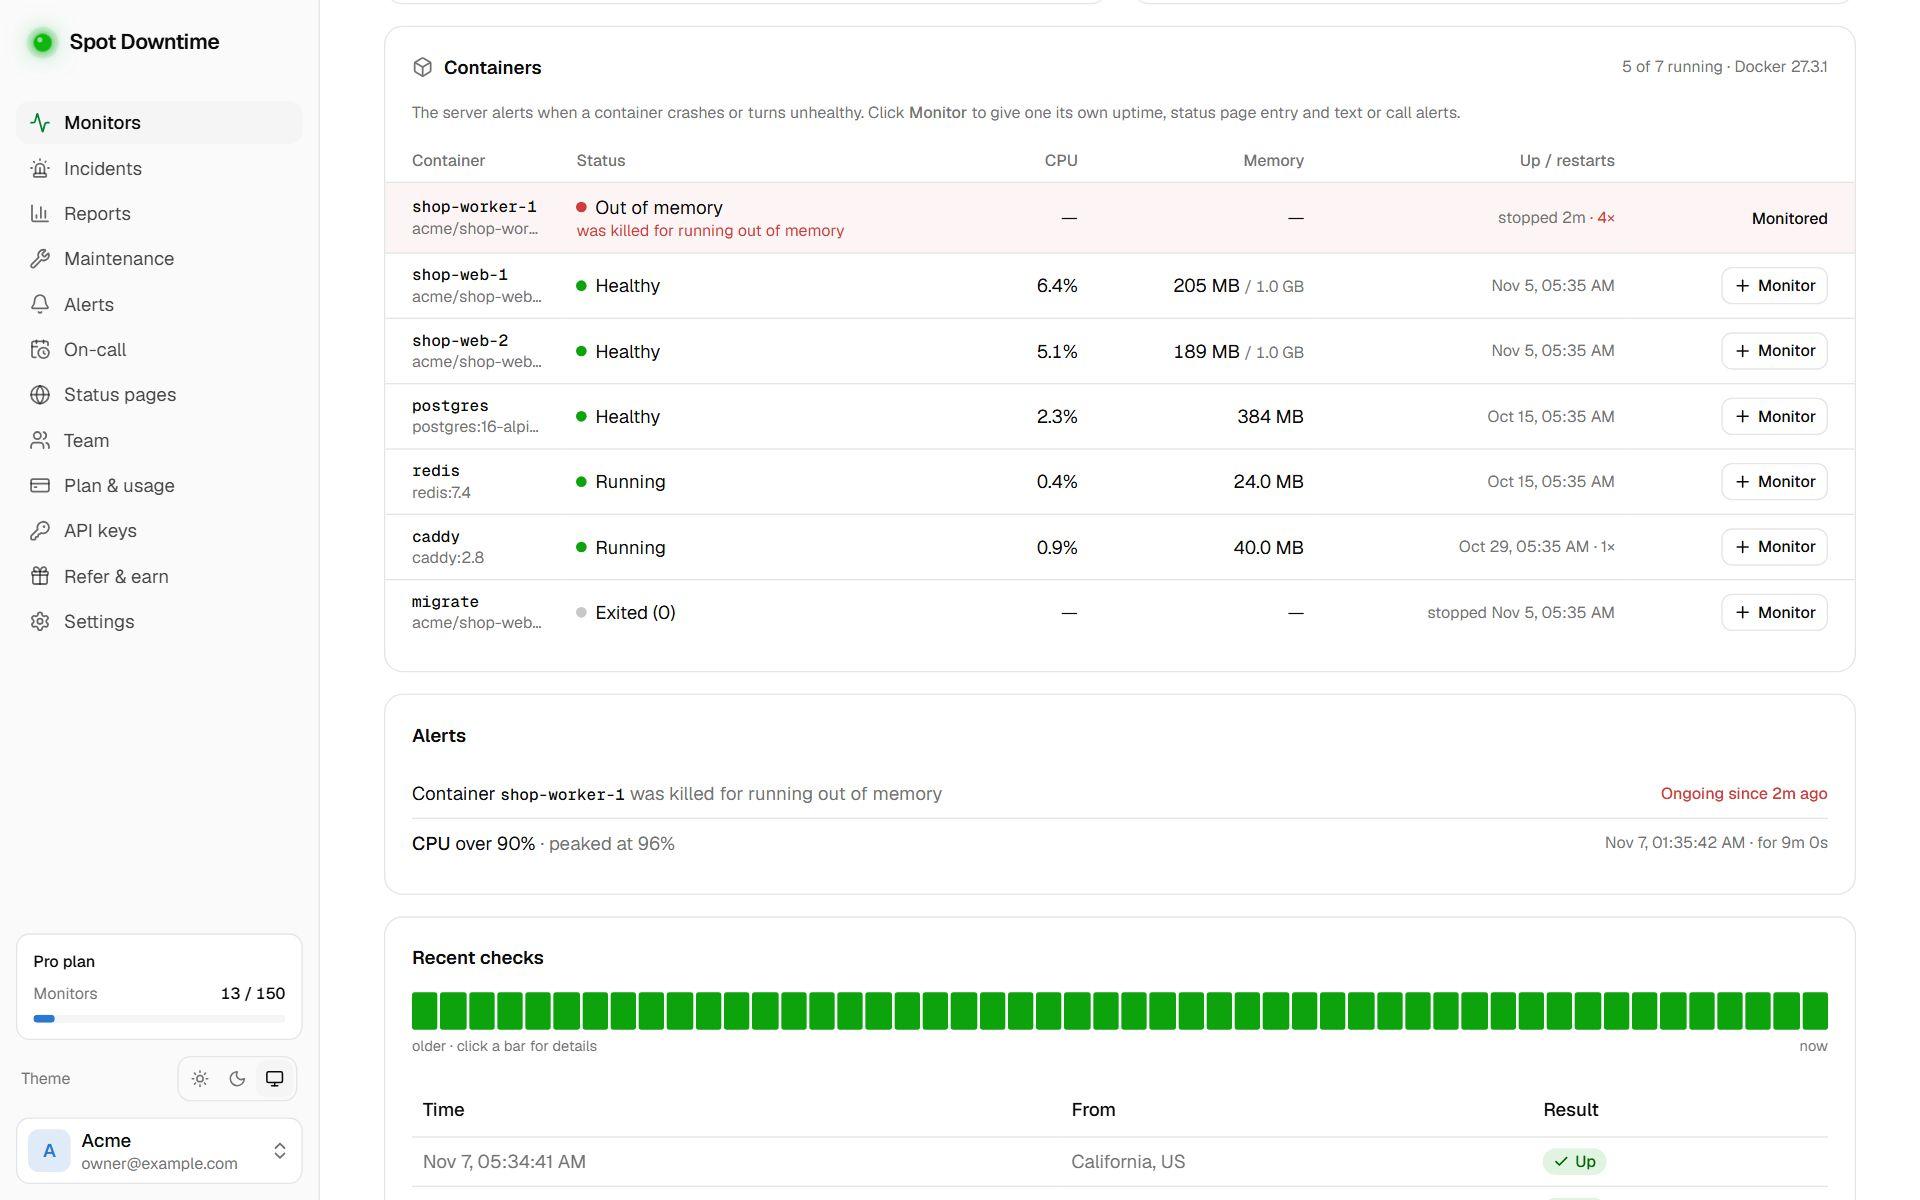
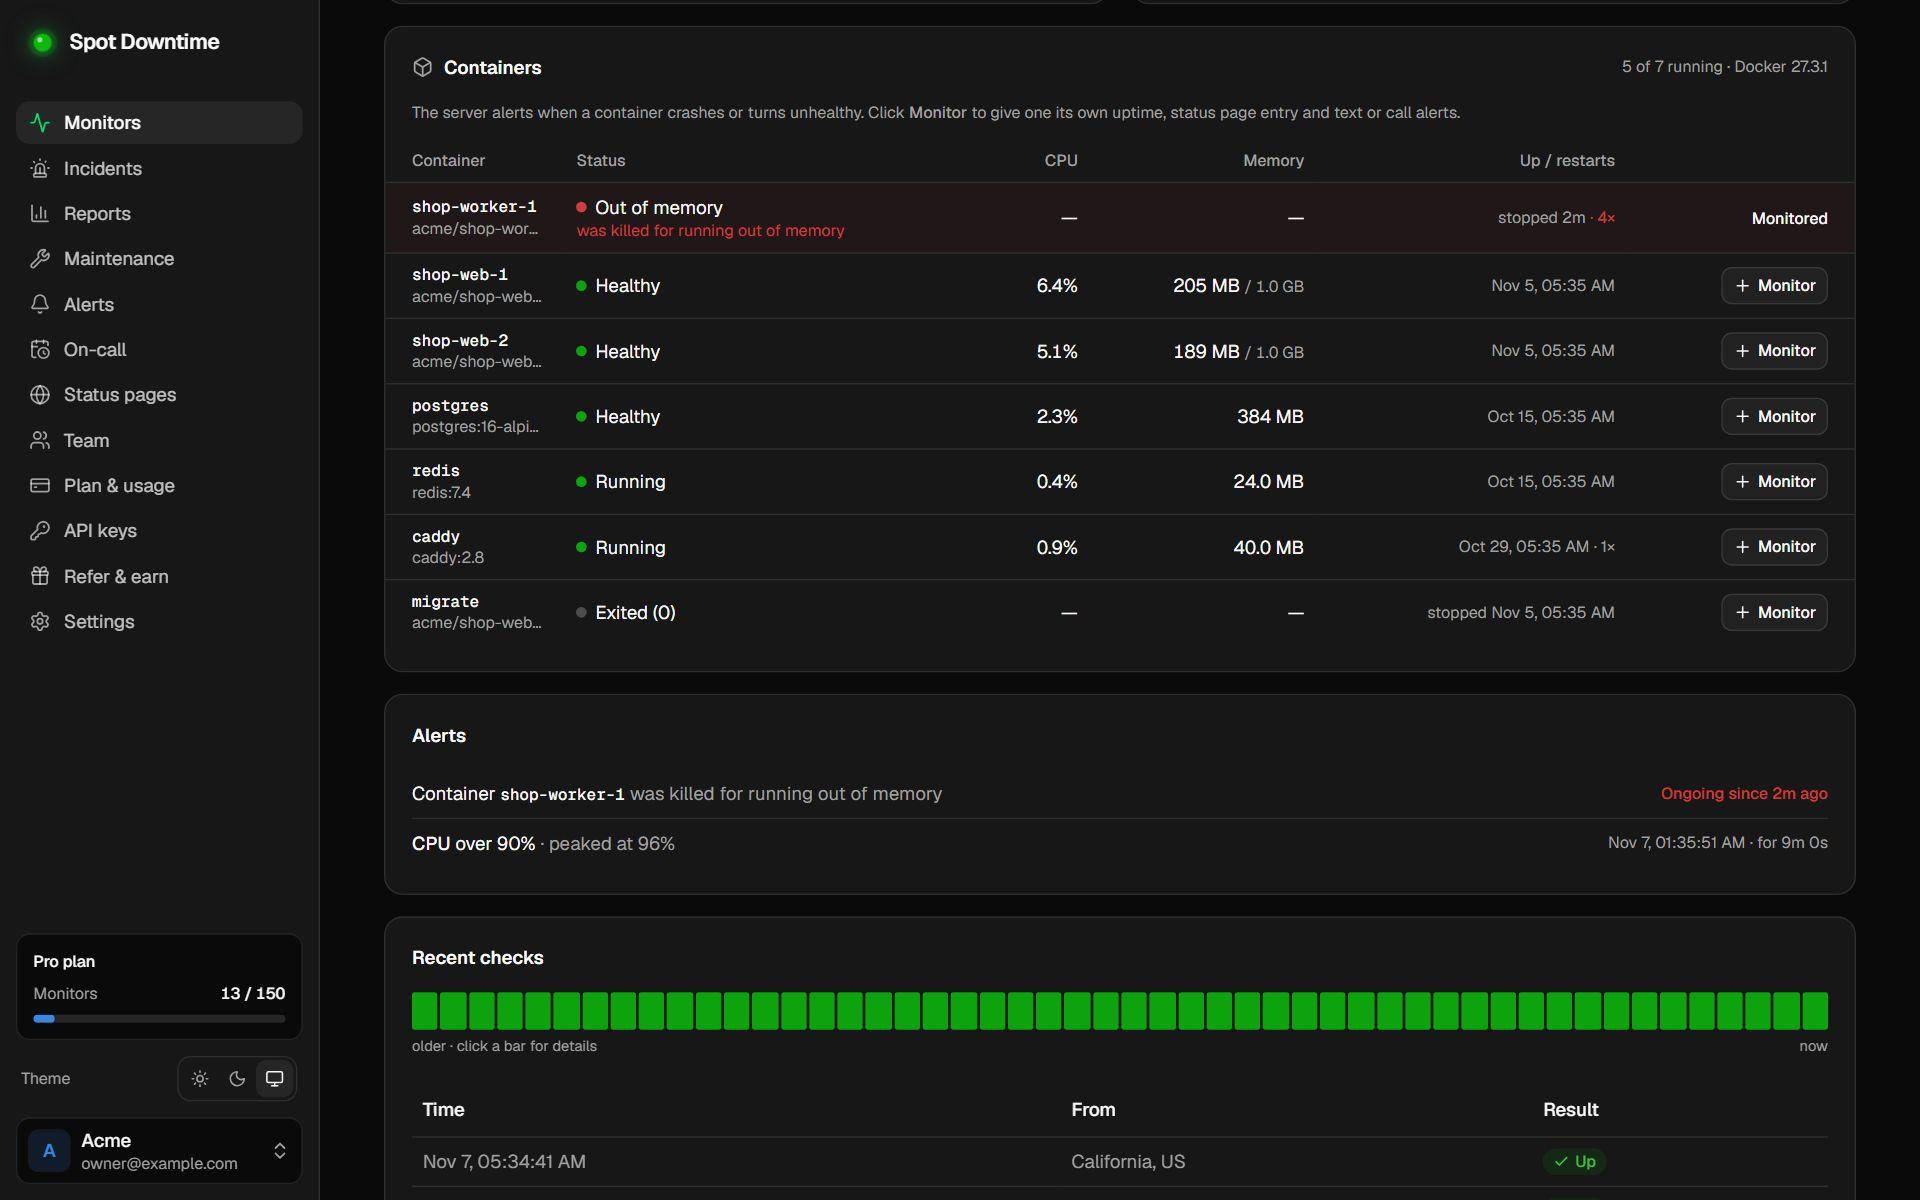
Uptime checks look at a server from outside: does it answer, is the website up, is the database port open. They tell you when something has already broken. Server monitoring looks from inside, at the resources that run out before things break: CPU, memory, disk space and network.
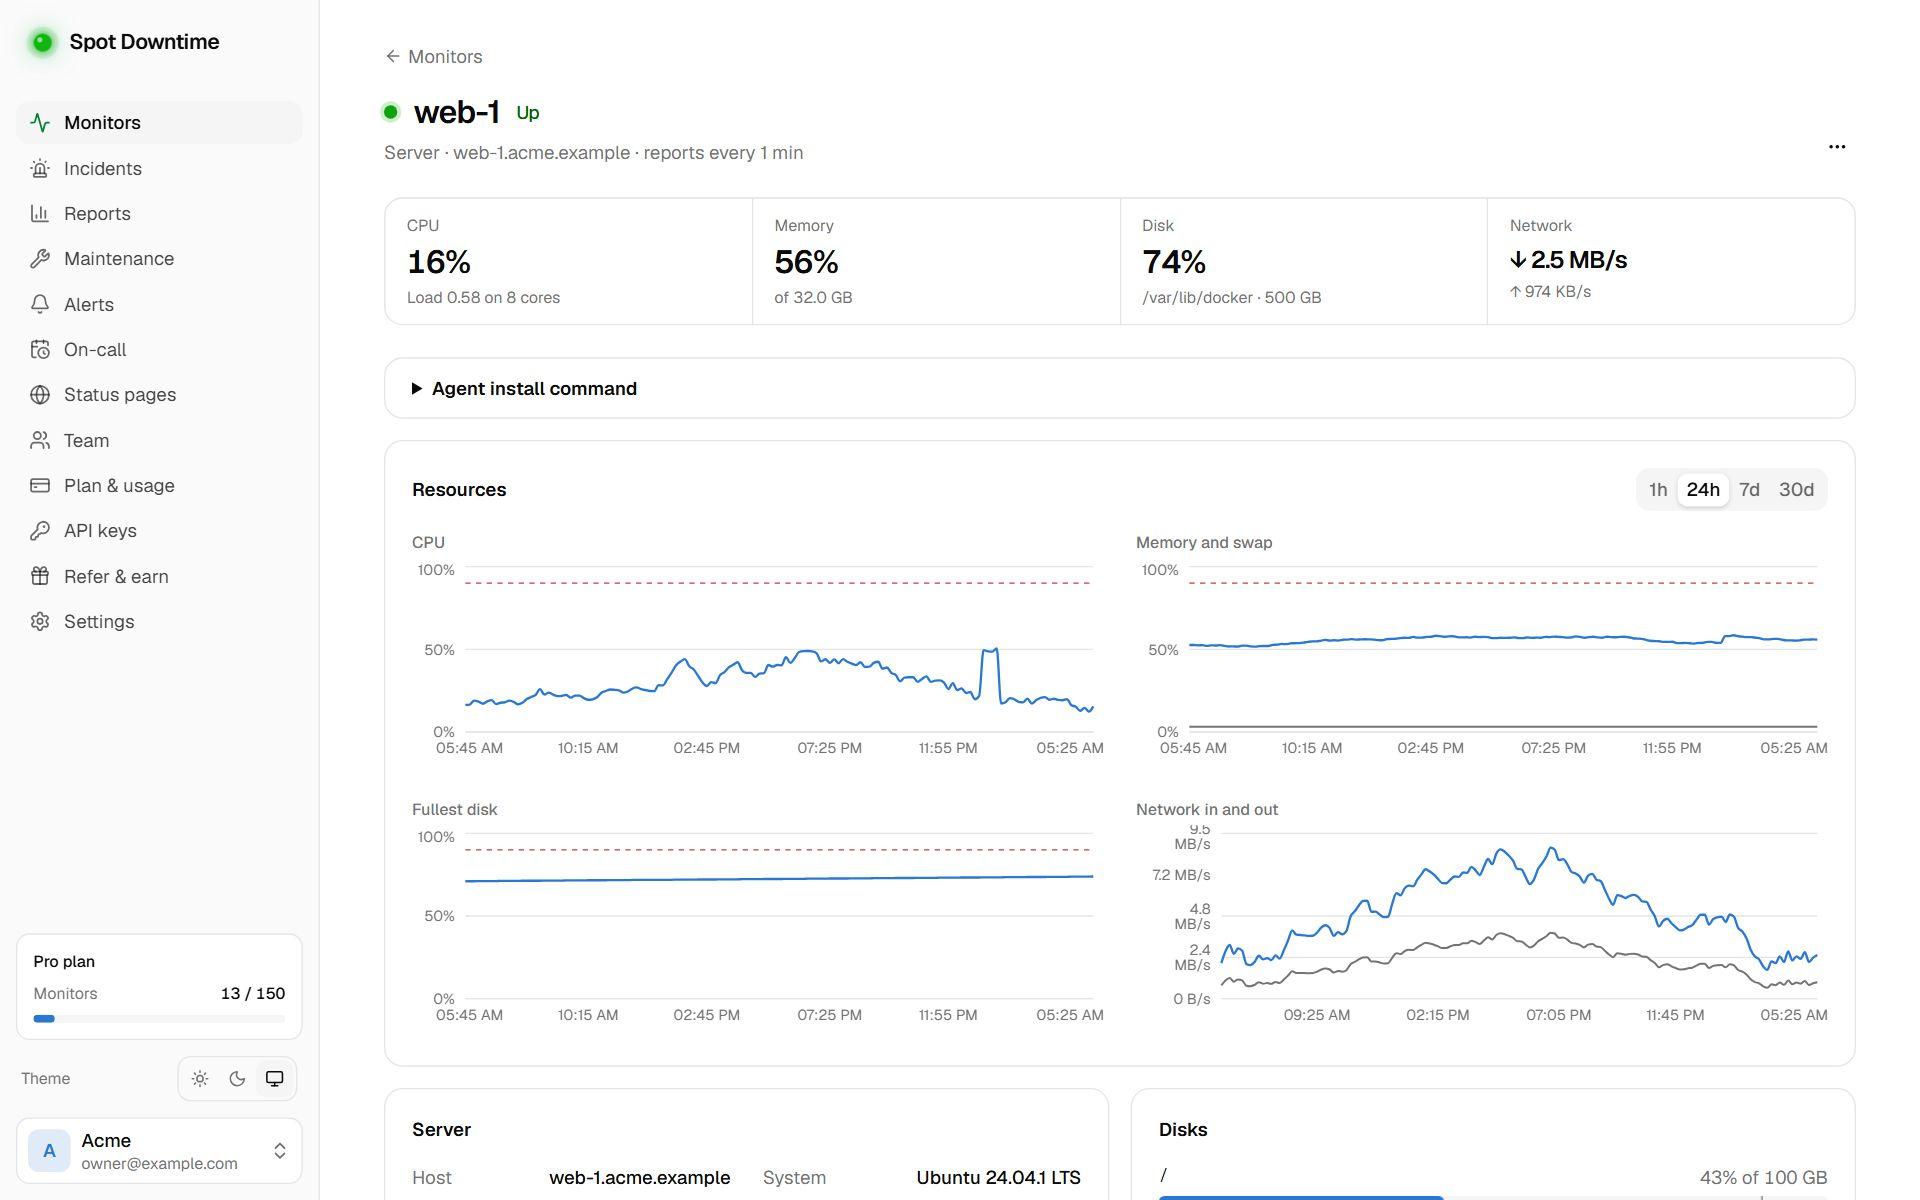
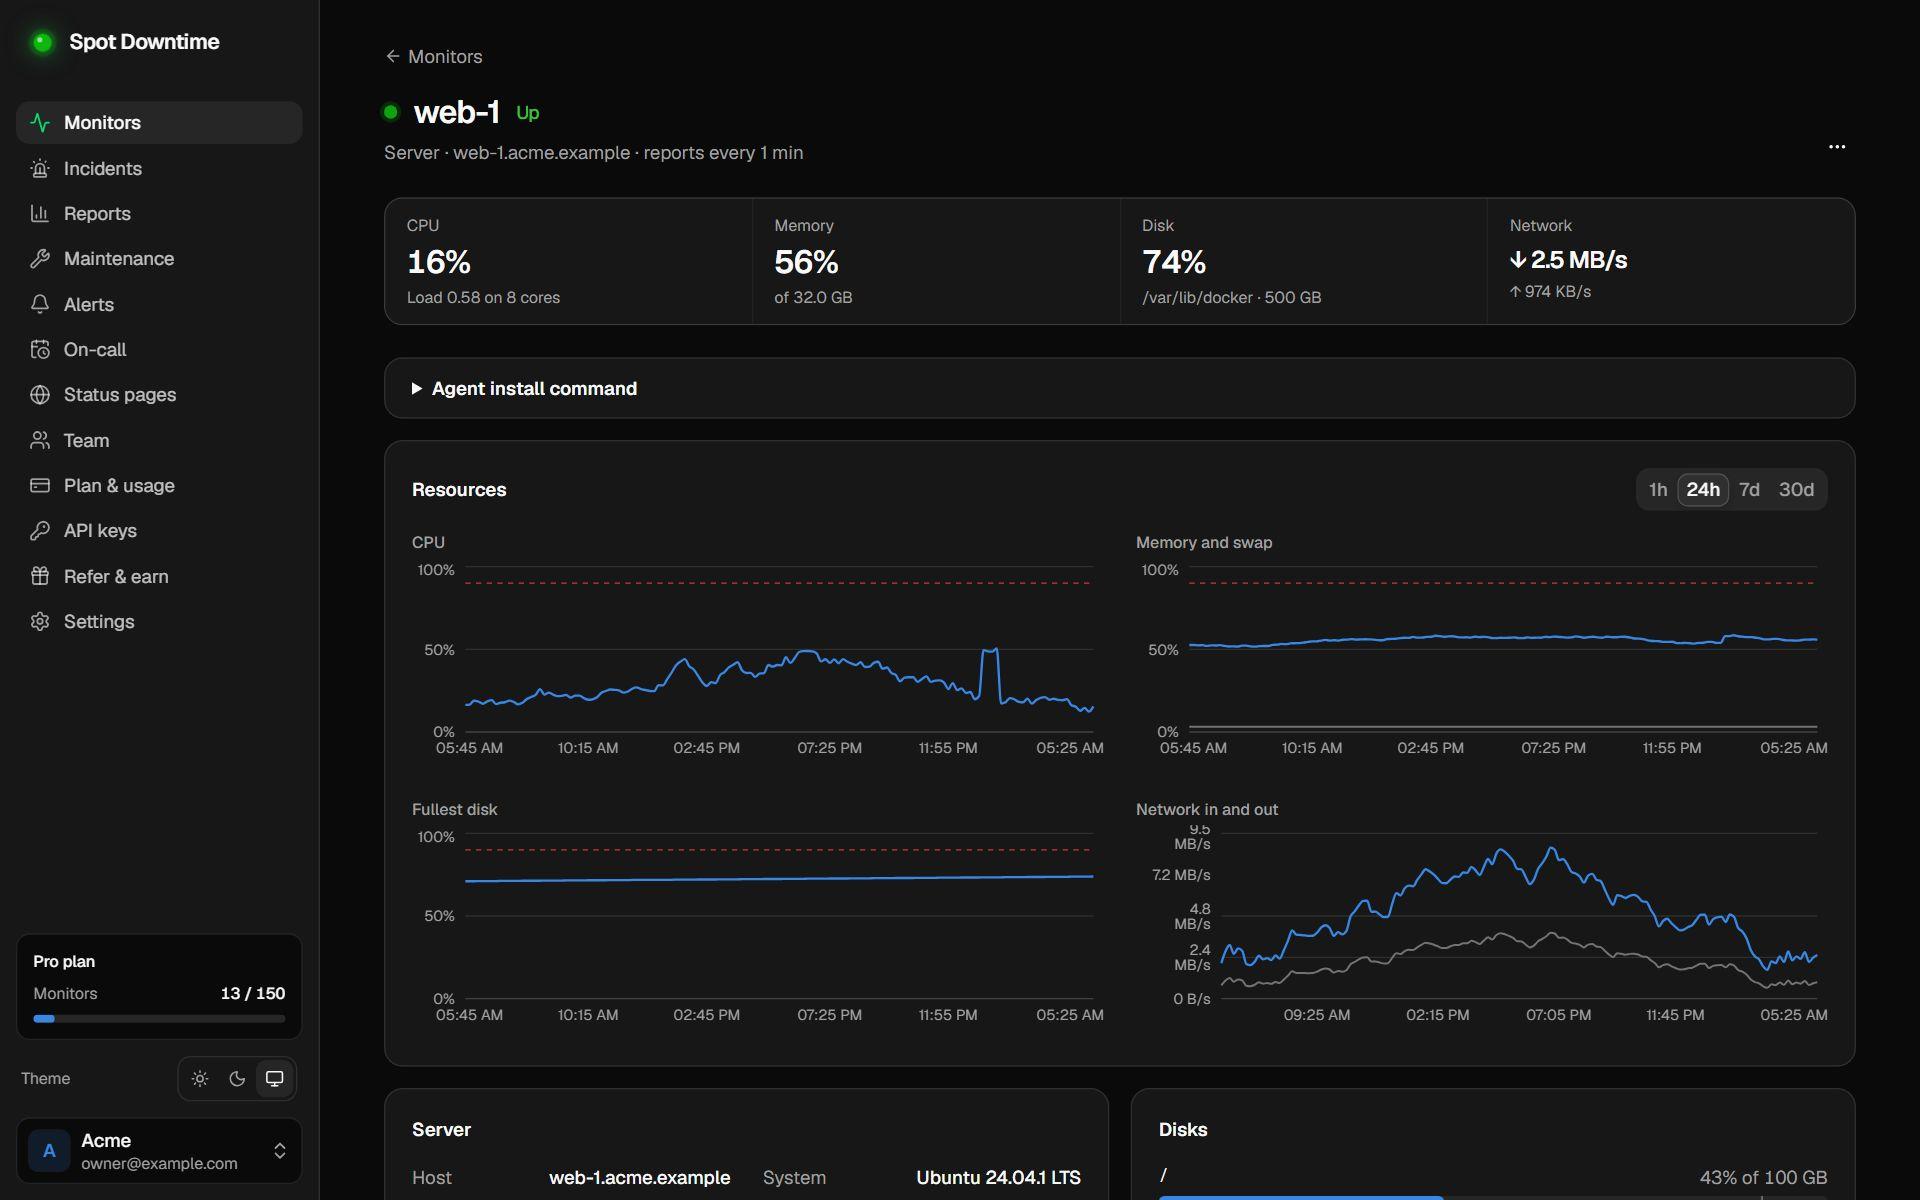
Spot Downtime's agent reads those numbers every minute and sends them to your workspace. Each server gets a page with live tiles, charts over 1 hour to 30 days, and every disk with its use and size.
Alerts that don't cry wolf
A busy server spikes to 100% CPU all the time, for a deploy, a cron job or a burst of traffic, and that's fine. What matters is CPU or memory that stays high. So those alerts use the average over a window you choose, 5 minutes by default, and only fire when the whole window is over your limit. They resolve once the value has been back under it for a full window, so they can't flap.
Disks are different: a full disk breaks things immediately, so a disk alerts as soon as it's over its limit, and the alert names the mount point, such as /var/log. And if the agent stops reporting, because the server crashed, lost its network or was switched off, the server is marked down and you get a normal down alert on every channel.
Built to be safe to install
The install script checks the download's checksum, creates a dedicated unprivileged user, and runs the agent as a hardened systemd service with a read-only view of the system and a 64 MB memory cap. It sends a test report before it finishes, so you know straight away whether the token and network are right.
The agent only makes outgoing HTTPS requests. It opens no ports, needs no firewall changes, and never runs anything it receives. Remove it any time with the same script and --uninstall.